Specifying the channel layout for plotting
The 2D channel layout is a representation of the channel positions, together with the outline of the head or other anatomical features, that allows data to be plotted in a topographically consistent manner on a 2D computer screen (or piece of paper). The 2D channel layout is not an exact representation of the channel positions, just a projection for the purpose of visualization.
The layout is a MATLAB structure with the following elements
layout.pos     = Nx2 matrix with the position where each channel should be plotted
layout.label   = Nx1 cell-array with the channel labels
layout.width   = Nx1 vector with the width of each box for multiplotting
layout.height  = Nx1 vector with the height of each box for multiplotting
layout.mask    = optional cell-array with line segments that determine the area for topographic interpolation
layout.outline = optional cell-array with line segments that represent the head, nose, ears, sulci or other anatomical features
You should note that the 2D channel layout for plotting deals with channels, which are not always identical to sensors or electrodes. For example, MEG sensors can have a considerable spatial extent. In the case of EEG you could record the HEOG by placing two electrodes on the left and right side of the eyes. The HEOG channel however is conceptually not located at either one of those electrode locations, but rather “between” those electrodes. You may choose to plot it in between the two electrodes, but also somewhere else in the layout and hence in your figure.
Furthermore, it can happen that multiple channels technically share the same sensor location, for example with the two planar gradiometers and the magnetometers of the Neuromag MEG system, or with the radial and tangential magnetometers of some OPM systems. To distinguish them in the multiplot display, some offset is needed between them. For a correct topographic interpolation, the different channels should be in separate layouts, which can then be combined in a single figure using ft_appendlayout (see below for examples).
Finally, there are cases where you do want different channels to overlap exactly in the layout, for example if you want to make a multiplot with fNIRS oxyhemoglobin and deoxyhemoglobin channels on the same place (using different colors to distinguish them).
Constructing a layout
Many of the FieldTrip plotting functions use a 2D layout of the channels for plotting. The layout is a schematic 2D representation for displaying the data on the computer screen or in print on paper. The layout results from ft_prepare_layout and can be constructed from
- the position of the sensor positions in 3D space
- an existing (template) layout on disk
- a photo or drawing of the sensor positions
- a schematic representation
3D sensor positions
The geometrically most accurate layout representation can be obtained from a 3D representation of the sensor positions as a grad/elec/opto structure. However, projecting 3D sensor positions to a 2D plane always incurs distortion, especially at the edges where the surface is “bending” away from view. Consider for example how the North pole is distorted on a map of the world.
Template layout from disk
A template layout from disk is easy to use. Furthermore, it has the advantage that care has been taken to add an outline of geometric features (e.g., the ears and nose, or the outline of the MEG helmet) and that a well-fitting interpolation mask (i.e. the region in which the topoplot functions should interpolate) is present. For example the CTF helmet layouts looks much more realistic than what you would get by projecting the 3D sensors onto a 2D place and drawing a circle with nose and ears around it.
From a picture
If you do not have a measurement of the 3D positions of your sensors, but do have a 2D representation of the sensor array as picture, you can use that to make a layout. Schematic pictures of the electrode arrangements are often available from the website of the vendor of EEG systems or caps.
Schematic layout
Sometimes a schematic layout is more convenient, since it “flattens” the head and allows to see all channels better. In the case of iEEG (either sEEG and/or ECoG) electrodes, it can also save a lot of work to locate the electrodes in 3D as explained in the human iEEG tutorial. Furthermore, for sEEG electrodes it can be difficult to come up with a geometrically accurate representation of the channels in 2D space.
Making a layout for MEG sensors
Using a template layout
Since MEG sensors are in generally fixed in a rigid helmet inside the dewar, and since the arrangement of sensors is the same for all MEG systems of the same type (e.g., CTT275, Neuromag306), it is not common to construct individual-subject MEG layouts. Instead, most people will simply use one of the template layouts.
For future OPM-based MEG systems it is more likely that MEG sensor layouts will differ from one subject to another subject. Constructing 2D layouts for OPM based systems can be done similar to the way that they are constructed for EEG systems. If you have the 3D description of the MEG sensors, you can also specify that as cfg.grad into ft_prepare_layout to make a 3D layout.
Creating a layout from sensor positions
Customized MEG layouts can be useful to avoid the distortion due to the projection of sensors in 3D space. For example if you present auditory stimuli to both ears and want to compare the AEF responses on the left and right, you can use the following code to make a layout.
grad = ft_read_sens('Subject01.ds', 'senstype', 'meg');

cfg = [];
cfg.grad = grad;
cfg.projection = 'orthographic';
cfg.width  = 2.0; % the 3D sensor positions are in cm
cfg.height = 1.5;
cfg.viewpoint = 'left';
cfg.channel = 'ML*';
layoutL = ft_prepare_layout(cfg);

cfg.viewpoint = 'right';
cfg.channel = 'MR*';
layoutR = ft_prepare_layout(cfg);

cfg = [];
cfg.direction = 'horizontal';
cfg.distance = 3; % the 3D sensor positions are in cm
layoutLR = ft_appendlayout(cfg, layoutL, layoutR);

In a similar way you can make a layout that combines a left, right, top, front and back view of the MEG sensors in a fold-out arrangement.
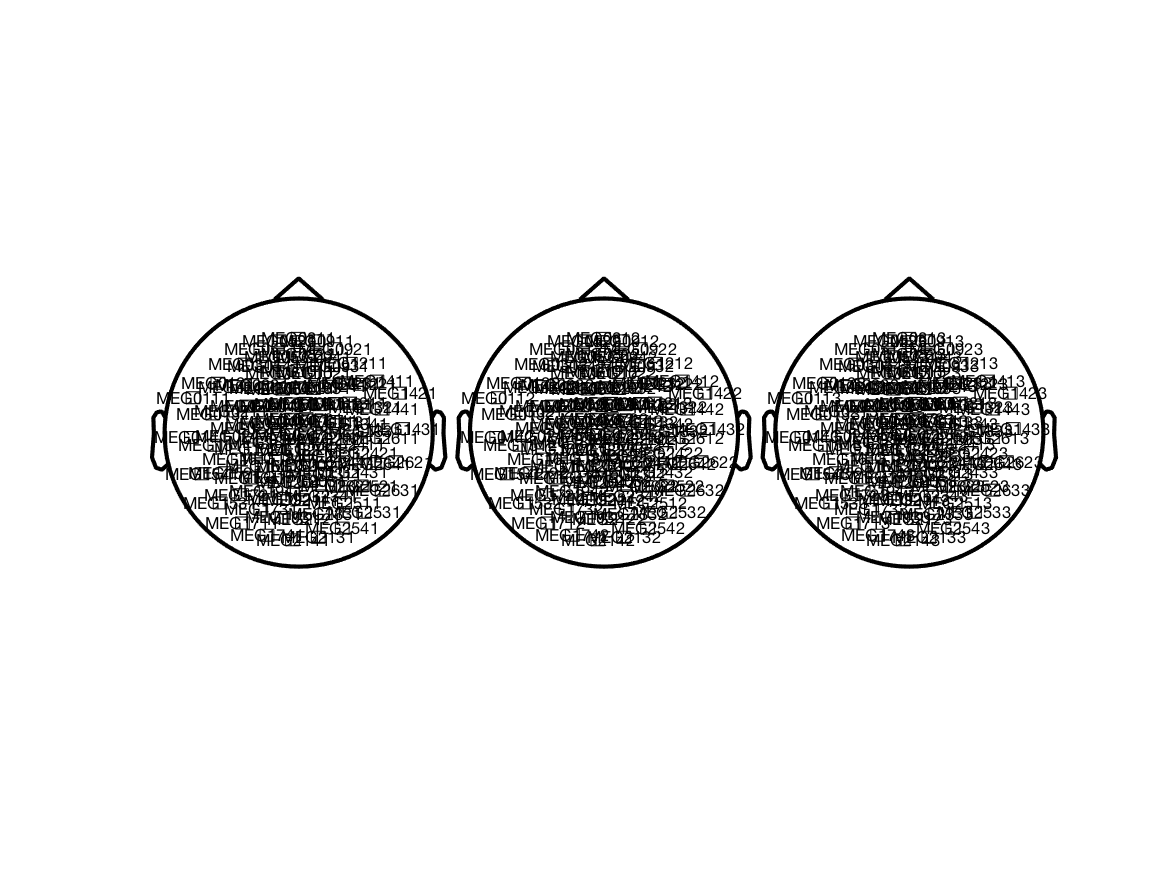
For the Neuromag/Elekta/Megin MEG system - which consists of sensor-triplets with a combination of planar gradiometers in the horizontal direction, planar gradiometers in the vertical direction, and magnetometers - you can make a layout that separates the different channel types.
grad = ft_read_sens('oddball1_mc_downsampled.fif', 'senstype', 'meg');

cfg = [];
cfg.grad = grad;
cfg.projection = 'polar';

cfg.channel = '*1'; % these are the magnetometers
layout1 = ft_prepare_layout(cfg);

cfg.channel = '*2'; % planar gradiometers
layout2 = ft_prepare_layout(cfg);

cfg.channel = '*3'; % planar gradiometers
layout3 = ft_prepare_layout(cfg);

cfg = [];
cfg.direction = 'horizontal';
cfg.distance = 0.3; % the layouts are approximately scaled to fit a unit sphere
layout123 = ft_appendlayout(cfg, layout1, layout2, layout3);
Since the magnetometers and planar gradiometers have different units (T and T/m), the magnitude of the channel level data is quite different. Combined plotting therefore requires that you scale the channels to a similar magnitude. FIXME
Making a layout for EEG electrodes
Using a template layout
Many labs use identical (or very similar) EEG caps. Consequently, the template EEG layouts included in FieldTrip cover many cases.
Creating a layout from 3D electrode positions
If you have recorded electrode positions, you can use the ft_prepare_layout function to make a layout by projecting the electrodes on the 2D plane.
Creating a layout from an image
You can also make a layout based on a bitmap image with the electrode arrangement. For example, the following image from the EasyCap website shows the equidistant M10 electrode arrangement.
You can specify cfg.image in ft_prepare_layout and subsequently click on the location of each electrode. After specifying each electrode location, you’ll be asked to specify the outlines of the head (i.e. the circle around the head, the nose and ears and optionally some lines representing other important landmarks). Finally you will have to specify the mask for the topographic interpolation, this is the same circle around the head (without ears and nose).
cfg = [];
cfg.image = 'easycap_m10_equidistant61chan.gif';
layout_m10 = ft_prepare_layout(cfg);
Making a layout for iEEG electrodes
Creating a layout from 3D electrode positions
The sEEG and ECoG electrodes can be localized in 3D from a CT and/or MRI scan as explained in the human iEEG tutorial. Following the electrode localization, you can make layouts using the orthographic projection method described in step 47 of that tutorial.
The procedure for anatomical coregistration and subsequent localizing of the electrodes explained in the ECoG and sEEG tutorial is based on the paper by Stolk, Griffin et al., Integrated analysis of anatomical and electrophysiological human intracranial data, Nature Protocols, 2018.
Creating a layout from an image
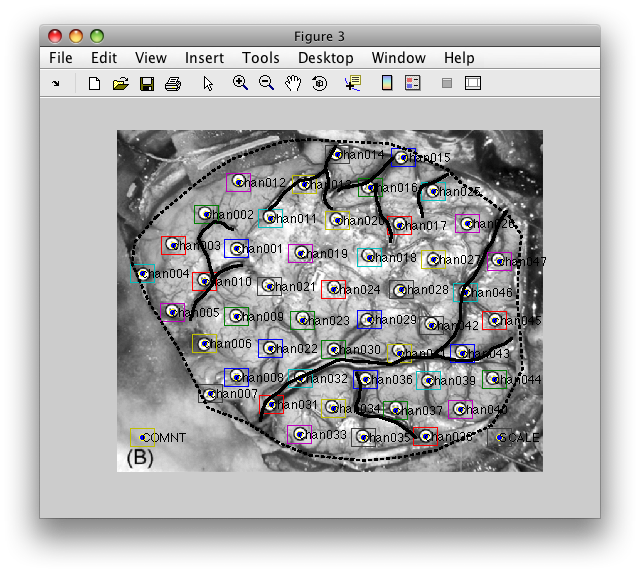
The placement of iEEG electrodes differs from one patient to the next patient. It is common that the neurosurgeon makes a sketch (on paper) of the electrode placement in relation to anatomical landmarks, such as the central sulcus. Or sometimes a surgical photo is taken of the EGoC grid that was just placed on the cortex (see for example Dalal et al. in Journal of Neuroscience Methods 174 (2008) 106–115)).
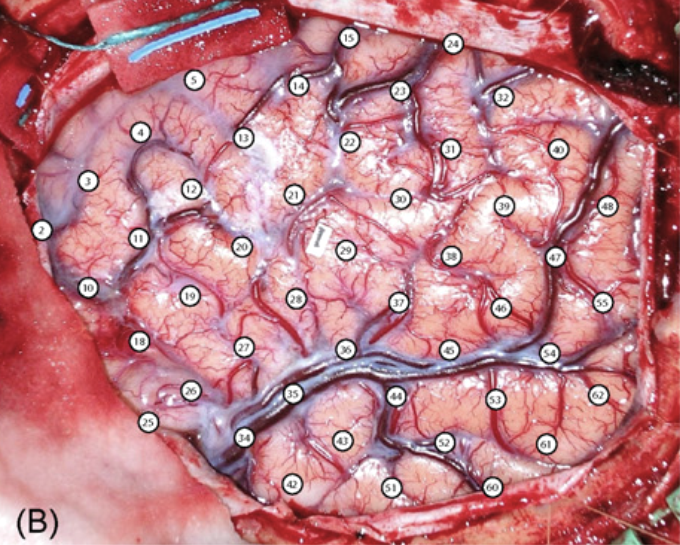
As in the EEG case, you can specify cfg.image in ft_prepare_layout and subsequently click on the location of each electrode. Instead of specifying the complete outline of the head as we usually do in EEG (as a circle), you may want to identify other important landmarks such as the major sulci and the outline of the trepanation.
You can also specify the mask for the topographic interpolation. If you have a large trepanation with multiple smaller grids without coverage in-between, you probably want to make a mask for the topographic interpolation around each grid, to avoid the ECoG potential from being interpolated in the gaps between the grids.
cfg = [];
cfg.image = 'dalal_ecog.png';
layout_ecog = ft_prepare_layout(cfg);
After creating the layout, you should check and/or manually assign the correct name of the channel labels in the label cell-array. Furthermore, you can place the SCALE and COMNT locations at a convenient place in the figure and modify the width and height of the boxes that are used for multiplotting. You can use ft_layoutplot for a visual inspection of the complete layout.
cfg = [];
cfg.layout = layout_ecog;   % this is the layout structure that you created before
ft_layoutplot(cfg);
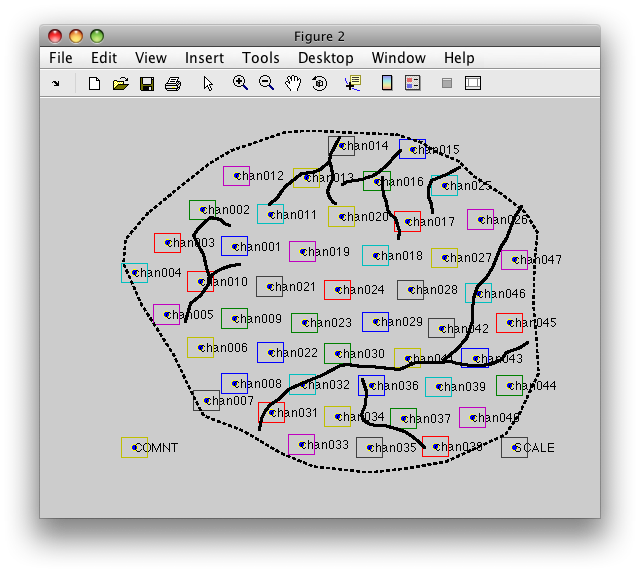
or including the original photo as black-and-white background image like this
cfg = [];
cfg.image  = 'dalal_ecog.png';    % use the photo as background
cfg.layout = layout_ecog;         % this is the manually created layout structure
ft_layoutplot(cfg);
Once you are happy with the result, you can save it to a MATLAB file like this:
save layout_ecog.mat layout_ecog
The MATLAB file can subsequently be specified as cfg.layout=’layout_ecog.mat’ whenever you need a layout for plotting. Alternatively, you can load the layout in memory and specify the layout like cfg.layout=layout_ecog.
The advantage of the MATLAB file over the ASCII file, is that the MATLAB file can also contain a user-specified outline of the head and user-specified mask, whereas for the ASCII layout file the same circle with nose and ears will be used.
Creating a schematic iEEG layout
Sometimes you want to construct an iEEG layout prior to doing the full anatomical pipeline, e.g., to check the iEEG data quality and/or whether the expected experimental effects are present in the functional data. You can use ft_prepare_layout in combination with the ft_appendlayout function.
A schematic layout can also be convenient, since it “flattens” the head and allows to see all channels better. Furthermore, for sEEG shafts it can be difficult to come up with a geometrically accurate representation of the electrode contacts in 2D space.
Creating a schematic layout for the sEEG shafts
The ft_prepare_layout function has the horizontal and vertical option for making an N*1 layout. For example
cfg = [];
cfg.channel = {'1', '2', '3', '4', '5'};
cfg.layout = 'horizontal';
cfg.direction = 'LR';
layout12345 = ft_prepare_layout(cfg);
The direction of the electrode contacts along the shaft can be specified as ‘LR’ (left-to-right) or RL for horizontal, and ‘TB’ (top-to-bottom) and ‘BT’ for vertical.
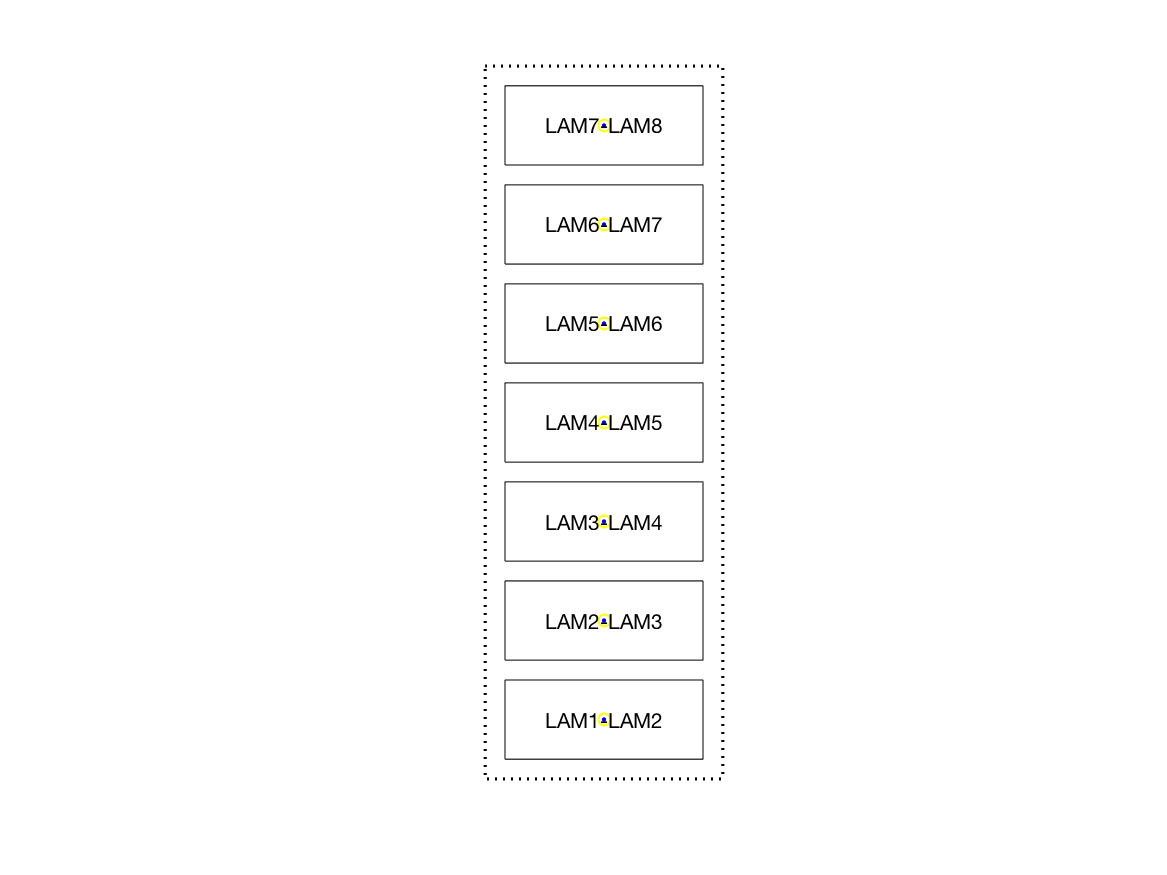
You can also use the raw or processed iEEG data to specify channel names. For example, the dataset used in the ECoG and sEEG tutorial has sEEG electrode shafts that start with the letters LAM, LHH, LTH, RAM, RHH, RTH and ROC. You can download the spectrally analyzed data SubjectUCI29_freq.mat and use the following
load SubjectUCI29_freq.mat

cfg = [];
cfg.layout = 'vertical';
cfg.direction = 'BT';
cfg.channel = 'LAM*'; % using wildcard for all LAM electrodes
cfg.width = 0.2;
layoutLAM = ft_prepare_layout(cfg, freq);
In the same way you can make layouts for all other shafts
% the other shafts in the left hemisphere
cfg.channel = 'LHH*';
layoutLHH = ft_prepare_layout(cfg, freq);
cfg.channel = 'LTH*';
layoutLTH = ft_prepare_layout(cfg, freq);

% and the right hemisphere
cfg.channel = 'RAM*';
layoutRAM = ft_prepare_layout(cfg, freq);
cfg.channel = 'RHH*';
layoutRHH = ft_prepare_layout(cfg, freq);
cfg.channel = 'RTH*';
layoutRTH = ft_prepare_layout(cfg, freq);
cfg.channel = 'ROC*';
layoutROC = ft_prepare_layout(cfg, freq);

figure;
ft_plot_layout(layoutLAM)
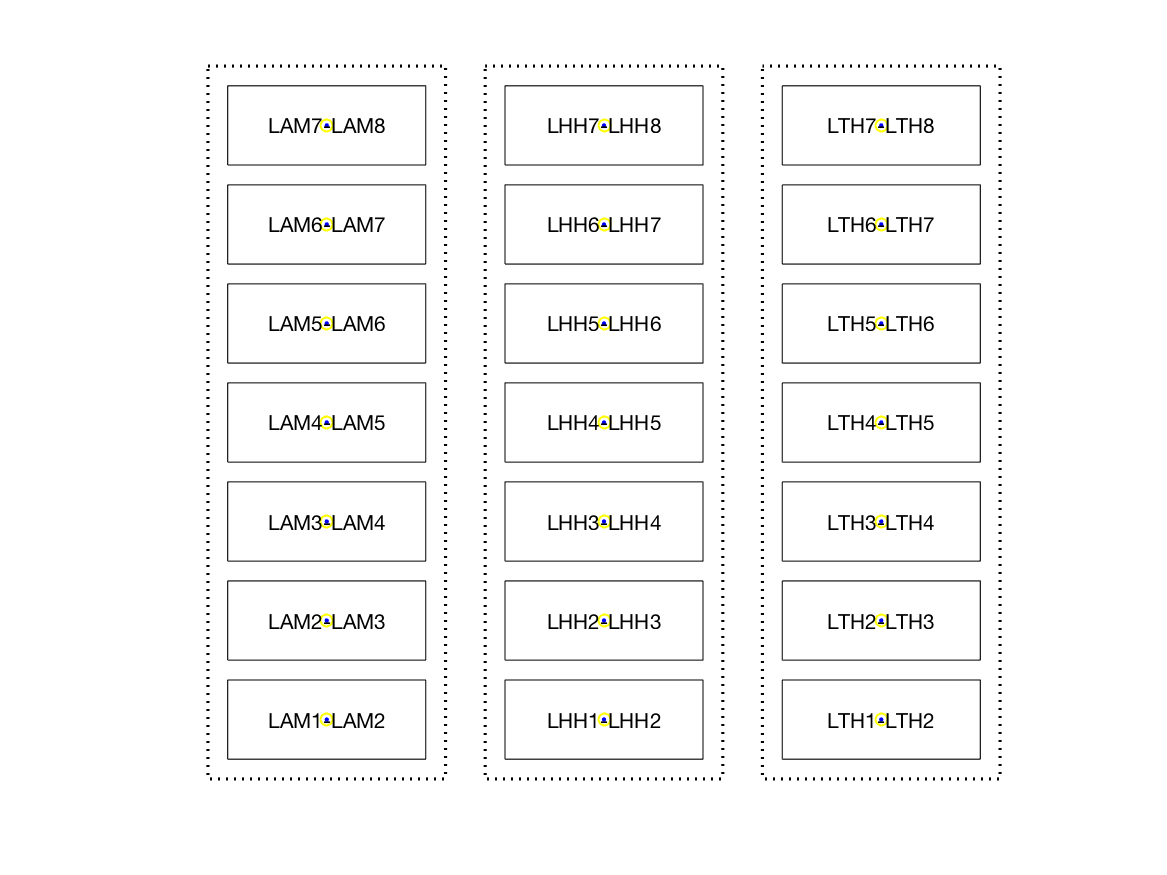
You can combine the layouts using ft_appendlayout like this
cfg = [];
layoutL = ft_appendlayout(cfg, layoutLAM, layoutLHH, layoutLTH);

cfg = [];
layoutR = ft_appendlayout(cfg, layoutRAM, layoutRHH, layoutRTH, layoutROC);

figure;
ft_plot_layout(layoutL);
And subsequently combine the left- and right-hemisphere layouts for the sEEG shafts with
cfg = [];
cfg.direction = 'vertical';
cfg.align = 'left';
cfg.distance = 0.1; % tweak the distance a bit
layoutShafts = ft_appendlayout(cfg, layoutL, layoutR);

figure;
ft_plot_layout(layoutShafts);

Creating a schematic layout for the ECoG grids
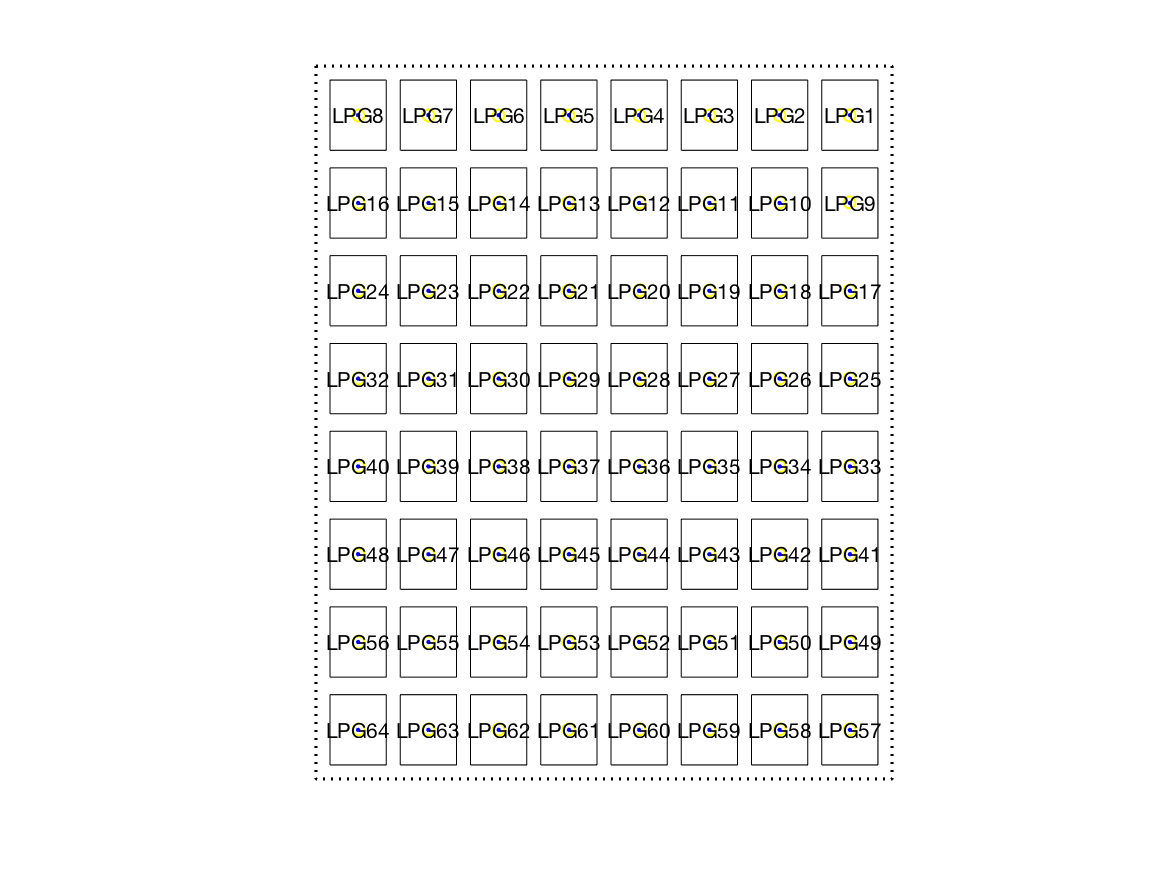
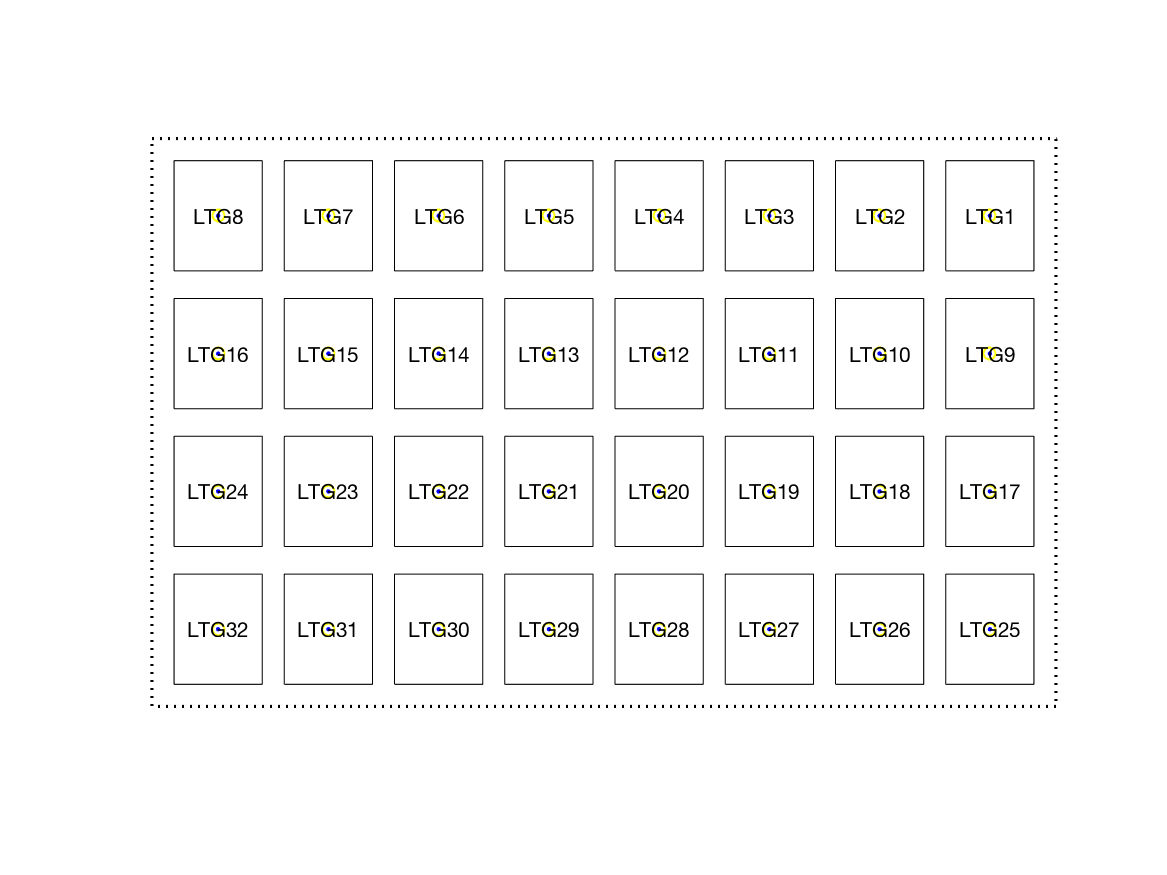
The example dataset includes an 8x8 ECoG grid over the left parietal cortex, and a 4x8 grid over the left temporal cortex, as displayed in this schematic drawing provided by the neurosurgeon.
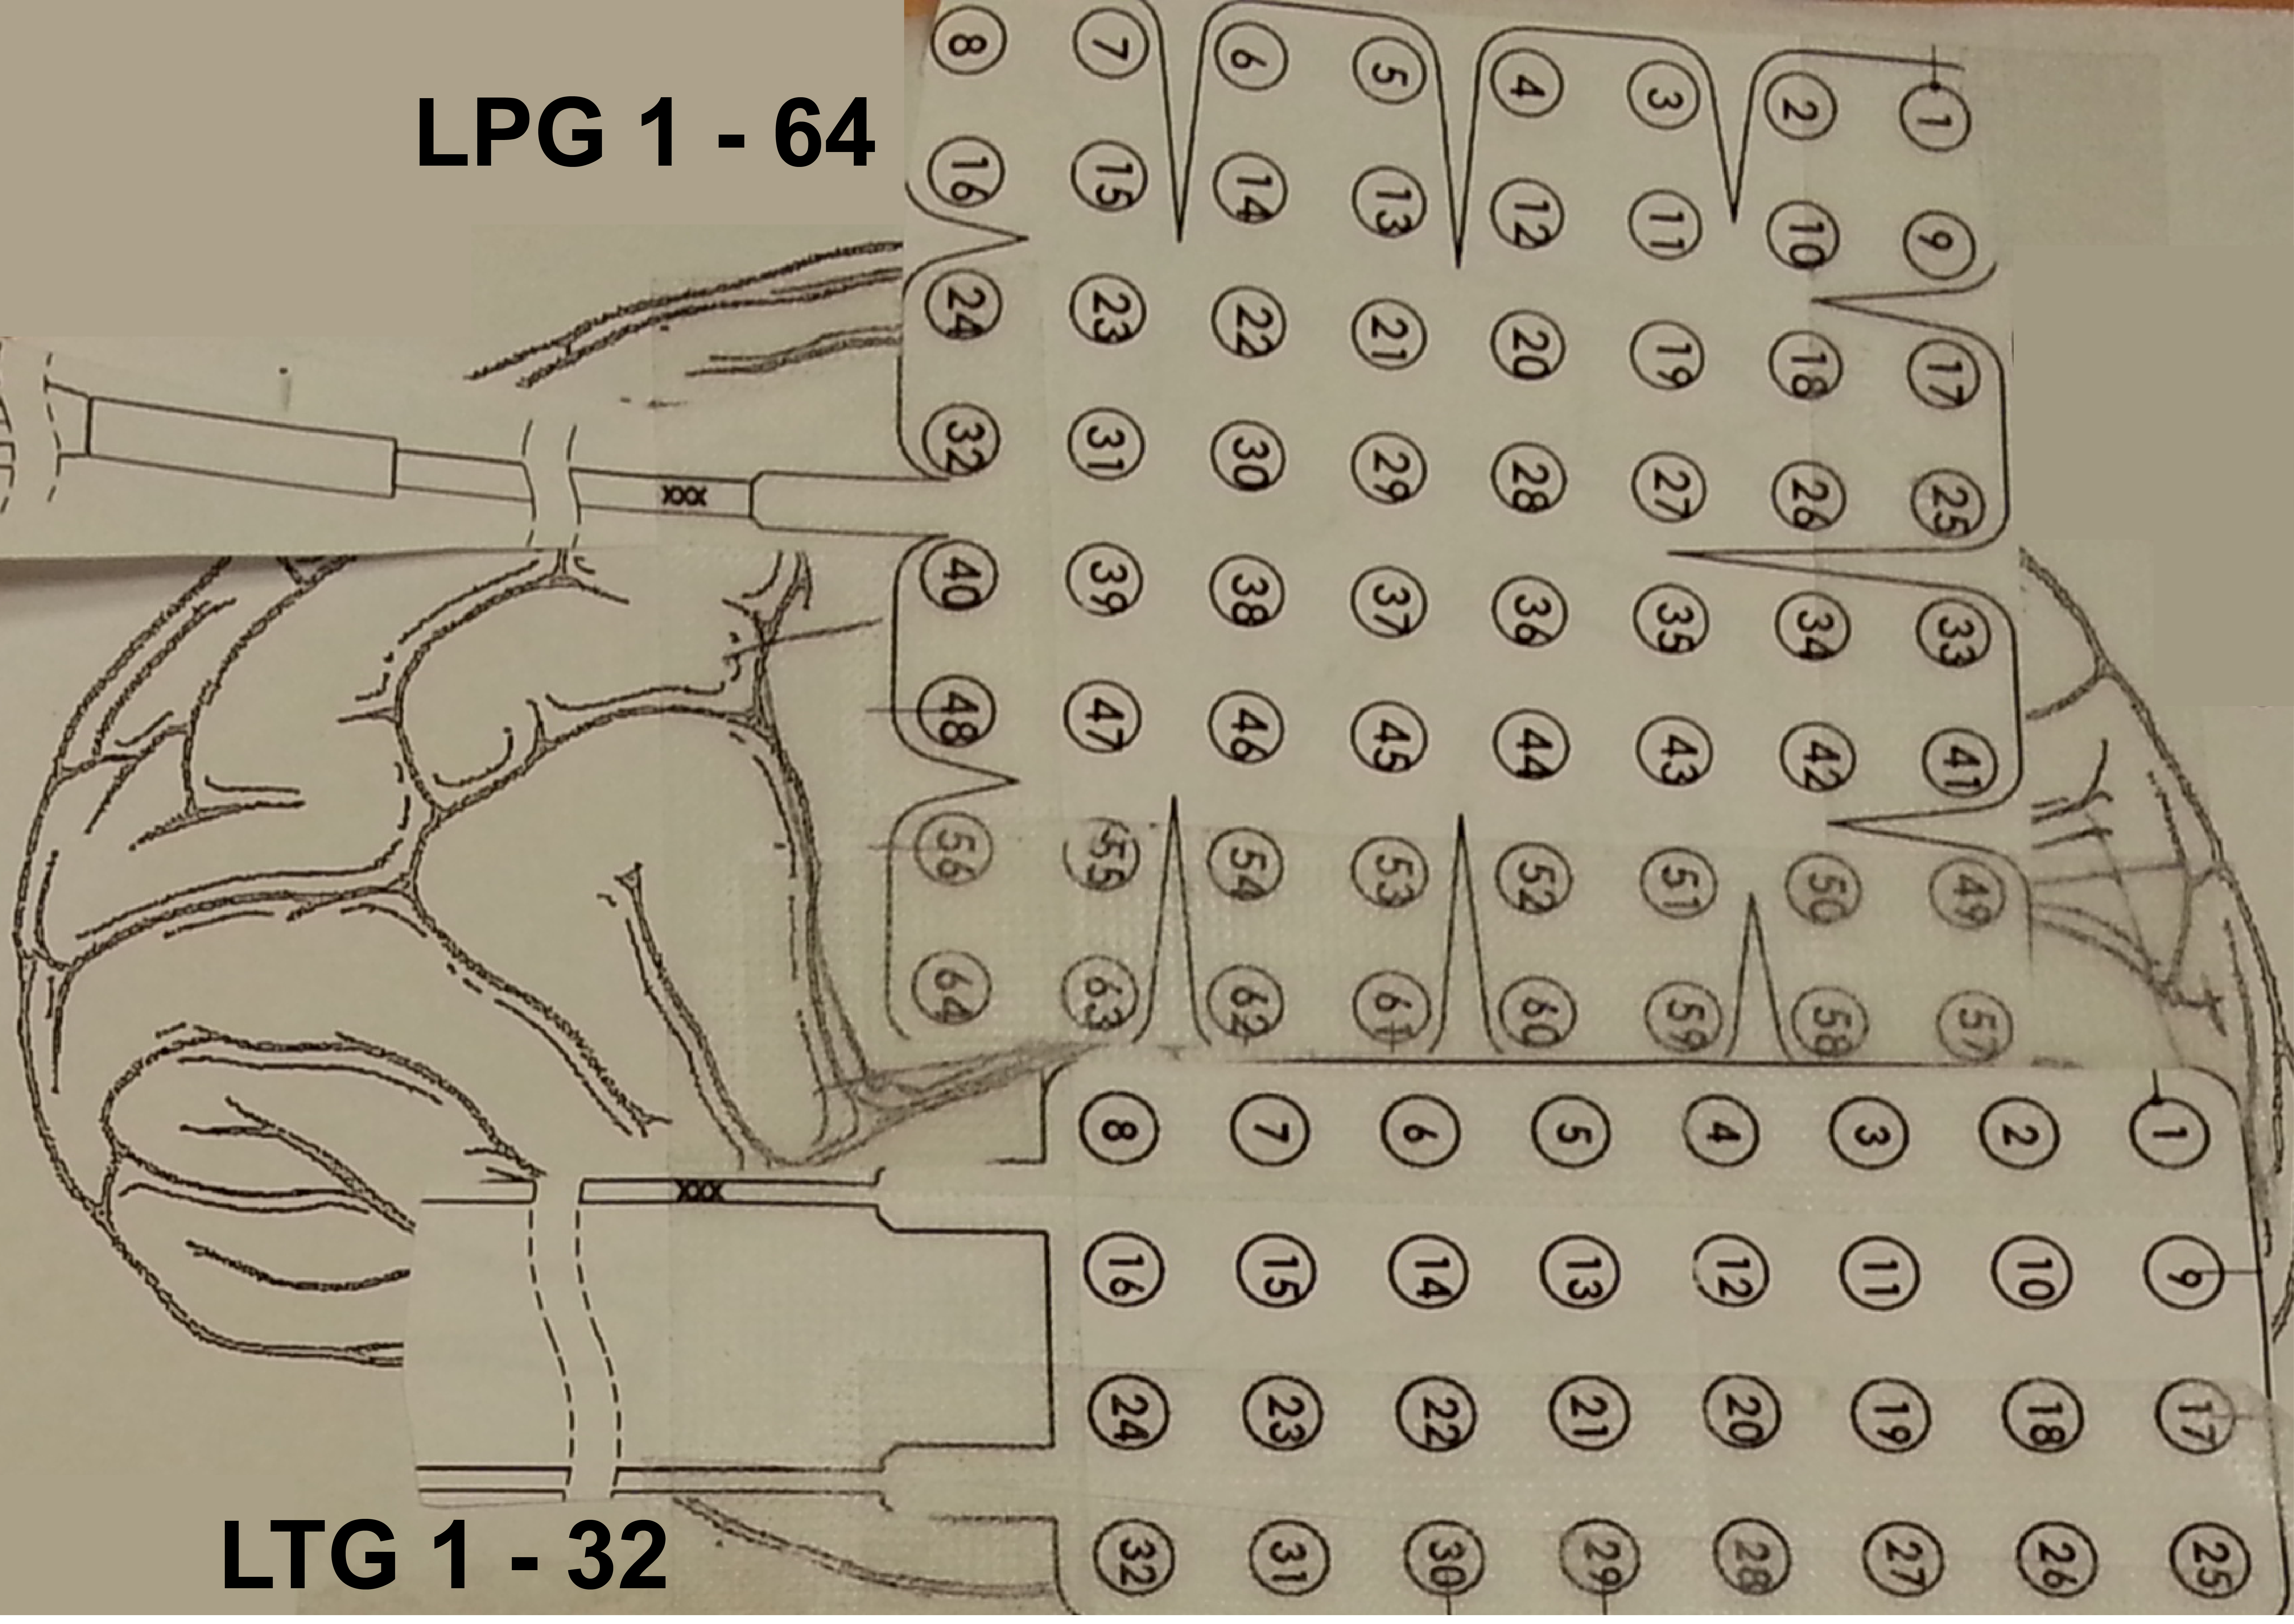
You can construct a layout for these ECoG grids by specifying ‘ordered’ and the number of rows and columns. The channel numbering starts in the upper right corner, hence we specify the direction ‘RLTB’ for right-left-top-bottom.
cfg = [];
cfg.layout = 'ordered';
cfg.direction = 'RLTB'; % this can require some trial-and-error
cfg.rows = 8;
cfg.columns = 8;
cfg.channel = 'LPG*';
cfg.height = 1/8; % scale the LPG and LTG grid consistently
layoutLPG = ft_prepare_layout(cfg, freq);

figure;
ft_plot_layout(layoutLPG);
cfg.rows = 4;
cfg.columns = 8;
cfg.channel = 'LTG*';
cfg.height = 1/8; % scale the LPG and LTG grid consistently
layoutLTG = ft_prepare_layout(cfg, freq);

figure;
ft_plot_layout(layoutLTG);
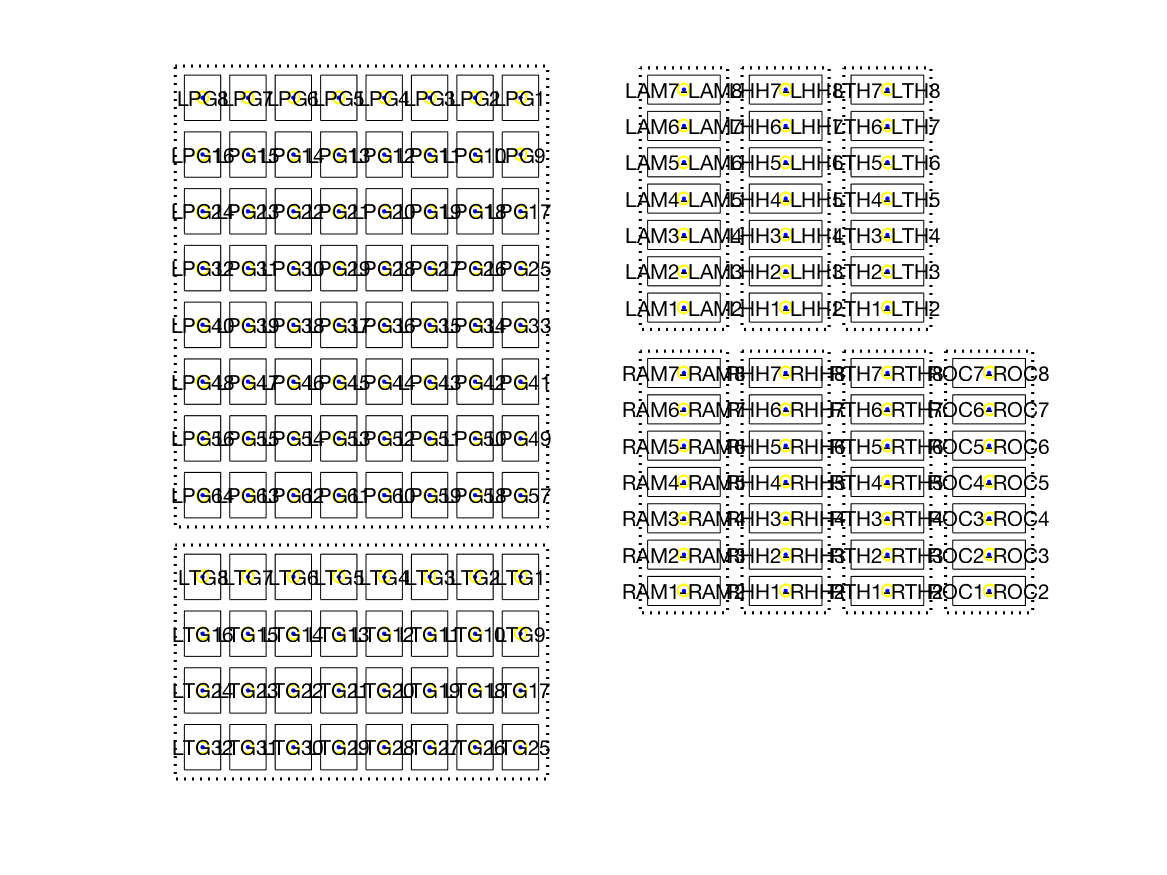
Combine the ECoG and sEEG layouts
We can now append the two ECoG grids vertically, and combine the layout of the ECoG grids with the layout of the sEEG shafts.
cfg = [];
cfg.direction = 'vertical';
cfg.align = 'left';
cfg.distance = 0.1; % tweak the distance a bit

layoutGrids = ft_appendlayout(cfg, layoutLPG, layoutLTG);

cfg = [];
cfg.direction = 'horizontal';
cfg.align = 'top';
cfg.distance = 0.3; % tweak the distance a bit

layoutAll = ft_appendlayout(cfg, layoutGrids, layoutShafts);
Subsequently you can use the combined layout of the shafts and grids to visualize the results of the ERP or TFR analysis.
cfg = [];
cfg.baseline = [-inf 0];
cfg.baselinetype = 'db';
cfg.layout = layoutAll;
ft_multiplotTFR(cfg, freq);
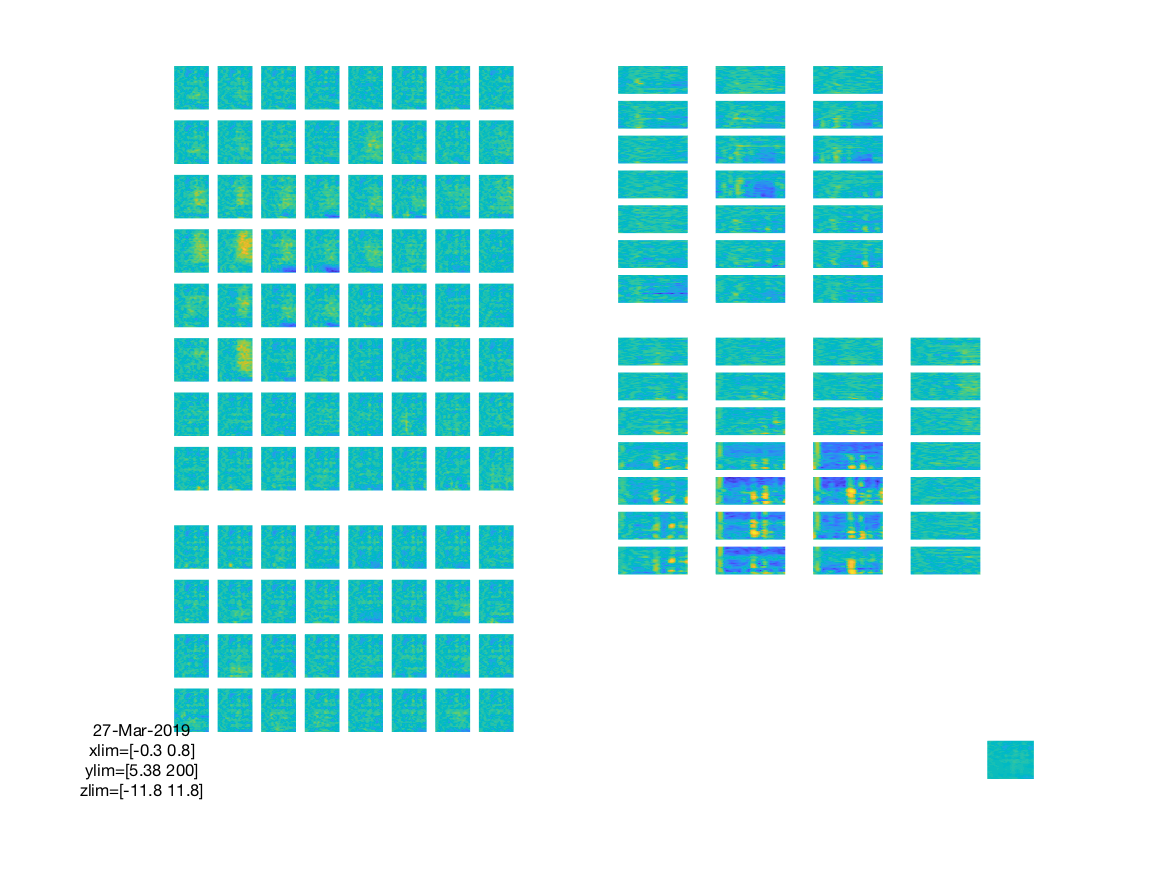
The figure created like this is interactive, like all multiplot figures, and you can make a selection of channels using your mouse and subsequently select a time-frequency range for which a topopgraphy is shown. Please be aware that the topoplot function will interpolate all channels as if they form a continuum. The interpolated values will only be shown withing the masked regions (the dashed lines in the layout plots) around each grid or shaft, but the interpolation will actually cause the values of one shaft to spill over to the next.
The topographic interpretation of the color-coded interpolated values on the ECoG grids is quite OK (although be aware of the interpolation artefacts where the two grids are close to each other), but the color-coded interpolated values on the shafts should be interpreted with caution.
Making a layout for LFP/spike electrodes
FieldTrip does not include specific template layouts for LFP or spike data. However, the functionality that is available for sEEG probes (see above) can also be used for laminar probes, and the functionality for ECoG grids (see above) can be used for regular NxM arrangemnents of electrodes that are more common in silicon probes like the Utah array.
For regular arragements the following options for cfg.layout in ft_prepare_layout can be used:
- ‘ordered’ will give you a NxN ordered layout
- ‘vertical’ will give you a Nx1 ordered layout
- ‘horizontal’ will give you a 1xN ordered layout
and the ordered layout can be specified in more detail with the options cfg.rows, cfg.columns and cfg.direction. Once you have a layout for a specific probe, you can save it to disk as a .mat or .lay file, share it and/or reuse it.
See also the probeinterface Python package with which you can design and specify probes for electrophysiological recordings.
Functions that make use of a 2D layout for visualization
Layouts that are constructed (or read from disk) using ft_prepare_layout are subsequently used in all 2D plotting functions in FieldTrip:
- ft_multiplotER
- ft_multiplotTFR
- ft_topoplotER
- ft_topoplotTFR
- ft_movieplotER
- ft_movieplotTFR
- ft_databrowser
- ft_neighbourplot
- ft_layoutplot
Furthermore, the ft_prepare_neighbours function allows you to specify a channel layout to determine neighboring channels. Note that it is more accurate to determine neighbors from the 3D representation of the channel positions, so you should only use the 2D layout if you don’t have actual 3D channel positions.
The format of layout files
The layout is represented on disk in ASCII file with the extension .lay, or in MATLAB .mat files that contain a variable with the name “layout” or “lay”. In general, MATLAB layout files are preferred since they allow a detailed specification of the outlines of the head shape (EEG) or helmet (MEG). For ASCII layout files a standard head shape that consists of a circle (for the head) with ears and the nose at the top will be drawn around the normalized channel positions.
Here is a small snippet of an ASCII layout file:
1  -0.308949  0.951110  0.750000  0.450000  Fp1
2   0.000121  1.000000  0.750000  0.450000  Fpz
3   0.309064  0.951004  0.750000  0.450000  Fp2
4  -0.808816  0.587705  0.750000  0.450000  F7
5  -0.411232  0.519845  0.750000  0.450000  F3
6   0.000257  0.499920  0.750000  0.450000  Fz
7   0.410919  0.519568  0.750000  0.450000  F4
8   0.809069  0.587789  0.750000  0.450000  F8
...
The format of the layout file is described in more detail in this frequently asked question.